Today, let’s discuss a crucial aspect of increasing sales: identifying the true high performers among your listings.
Pinpointing your top-performing listings is essential because it allows you to:
- Dedicate more effort to optimizing them, thereby increasing their sales potential.
- Learn from the successful strategies used in these listings and replicate that success.
It might come as a surprise, but the number of sales alone is not the sole indicator of a good product. Sales figures are directly related to the number of views a listing receives, and on platforms like Etsy, views are heavily influenced by the search algorithm rather than the inherent appeal of your product.
However, we have additional data at our disposal, such as views and favorites, which can help us distinguish exceptional listings from the average ones.
The Key Metrics for Identifying Top Products
Engagement Metrics
Daily Views: This refers to the average number of views a listing receives per day. Higher daily views indicate a demand for the keywords used and increase the likelihood of converting views into sales. Essentially, it becomes a numbers game.
Number of Favorites: This metric indicates how many users find your product interesting. However, it cannot be directly compared across listings because the age of the listing influences this number. For instance, two listings with 100 favorites each may not be equally engaging if one listing is a year old while the other is just a month old.
Favorite Ratio: This metric represents the number of favorites relative to the number of views a listing has. By normalizing the data, it allows for fair comparisons among different listings in your shop.
Combined, daily views, favorites, and favorite ratio give us insights into how engaging a listing is.
Conversion Metrics
If you have already made sales:
Conversion Rate: This is the ratio of sales to views and provides a standardized way to compare listings. For instance, if a listing has 100 views and generated 2 sales, the conversion rate is 2%. In simple terms, a 2% conversion rate means you get 2 sales for every 100 views.
A good conversion rate varies depending on categories and product types, but everything above 1% is good and conversion rates falling between 2% and 5% are considered amazing.
Understanding Statistically Significant Data
Before proceeding, it’s essential to consider an important caveat when using this data to make decisions: statistical significance. In simple terms, this means having enough data, either in the form of sufficient views or enough time passed, before drawing conclusions.
For example, let’s imagine two products:
- Product A has 1000 views and 10 sales, or 1% conversion rate, not too shaby.
- Product B was recently created and has only 10 views but already got 1 sale, resulting in a 10% conversion rate.
While Product B’s conversion rate appears considerably better, it lacks sufficient data to be reliable. Drawing the line between statistically significant and insignificant data will depend on the situation, but always keep this in mind when analyzing your data.
Utilizing Listadum to Identify Your Best Listings
Now that we understand the different metrics for assessing a listing’s potential, we need to compare all our listings to identify the top performers. Gathering all this data manually can be cumbersome, but thankfully tools like Listadum come to the rescue and perform these calculations for us.

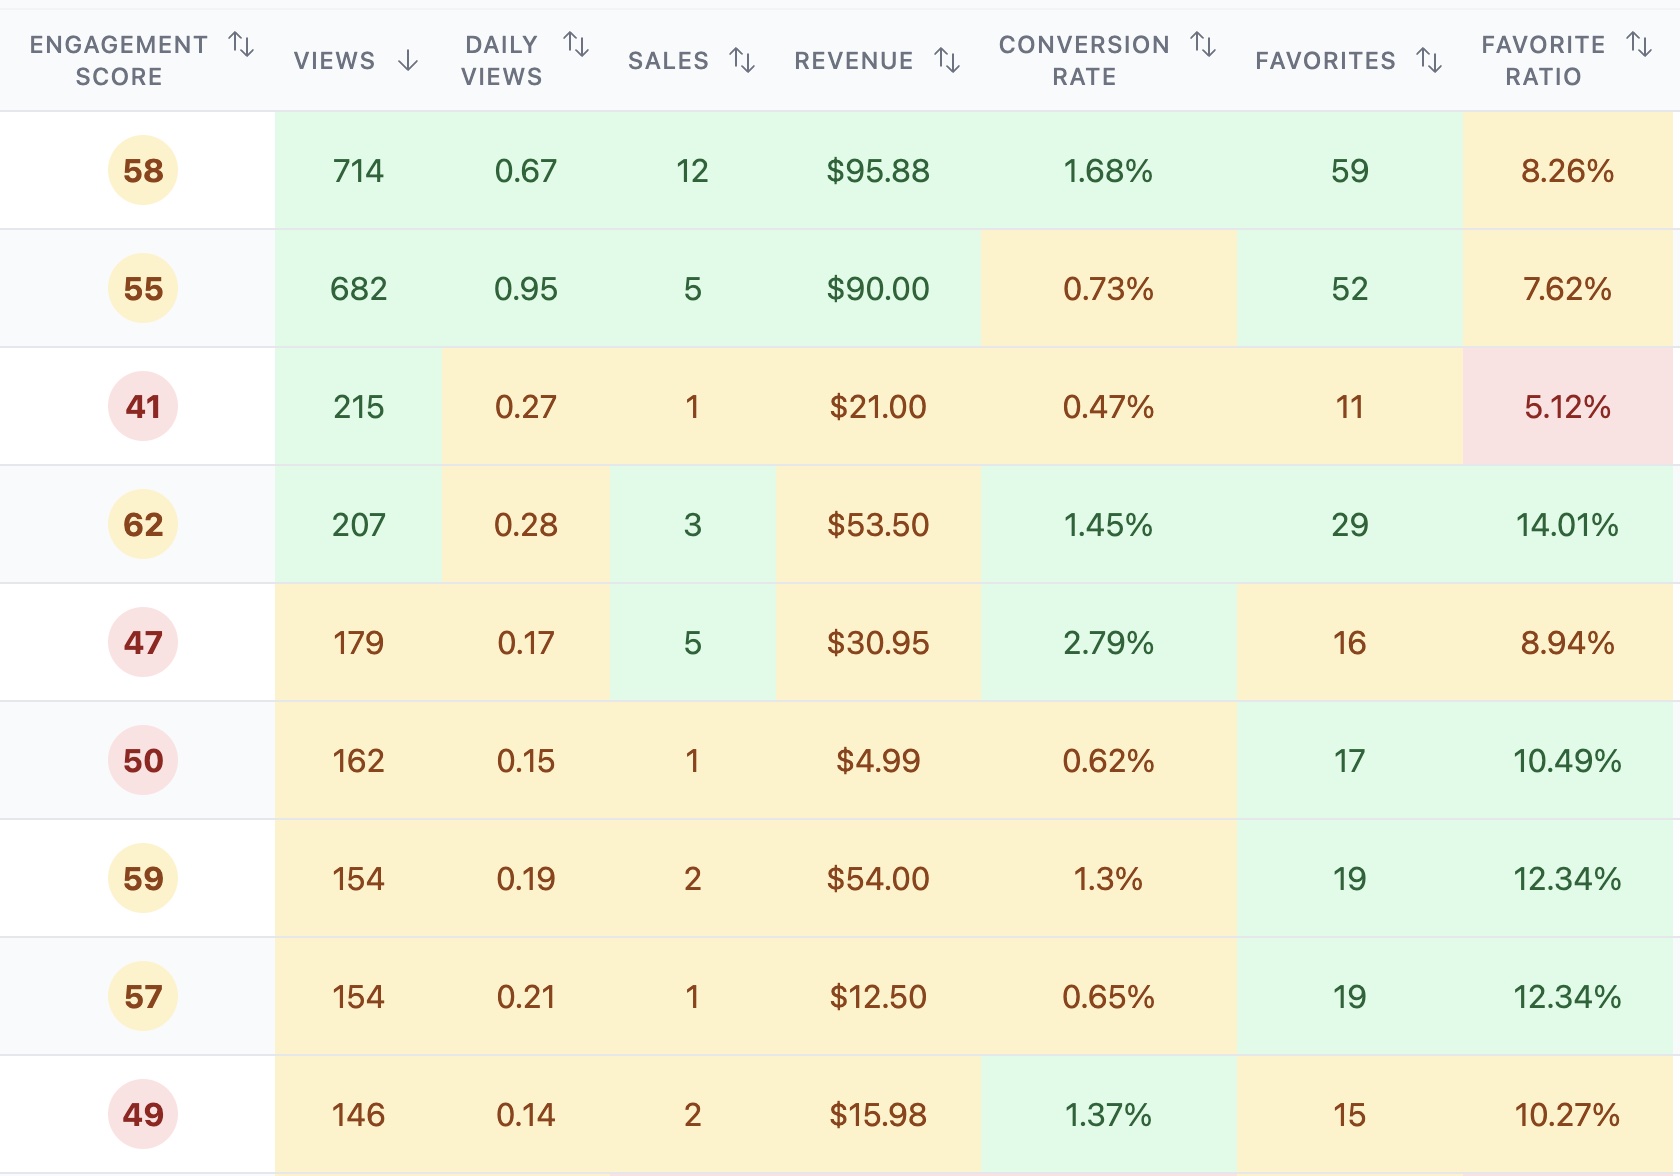
After creating an account and connecting our store to the platform, all our listings are automatically imported and evaluated. The dashboard displays a table with all our listings, sortable by various metrics mentioned earlier (daily views, favorites, favorite ratio, conversion rate, etc.). The table is color-coded to highlight better-performing values.
Additionally, Listadum provides an “engagement score” for each listing, allowing us to compare engagement against other listings within our category using similar tags and keywords. This is a valuable way to assess where we stand, not just between our own listings, but against the competition (keep in mind that Listadum does not have access to other shops conversion data, so this is only comparing engagement).
What’s Next?
Now that you have identified your objectively best-performing listings and have enough data, you can start making data-driven decisions! Here are some ideas on how to proceed:
- For listings already performing well, focus on them and increase views by promoting your work off-platform to boost sales further.
- If a listing receives plenty of views and favorites but has low sales, consider revising the pricing as it may be a barrier to conversion.
- If a product shows high conversion or engagement rates but lacks sufficient views, consider optimizing tags and descriptions or promoting the product off-platform to attract more views. Etsy’s search algorithm may not be reaching potential customers effectively.
- For a listing that is consistently underperforming with minimal views and sales, try revising the tags, monitor if it attracts more views, but if not, consider discontinuing the product and focus on other successful items.
We hope this article has provided valuable insights into identifying your top-performing listings and given you practical ideas on how to utilize this information effectively. Good luck with your store!